Conditional Formatting (CF) allows users to highlight important items in a visualization using mathematical or logical rules and graphical adjustments to the underlying chart or grid. As described in the overview, Conditional Formatting in visualizations can be set from multiple "entry points" in Discover. The easiest is via the right-click context menu, which will prompt the user with appropriate options based on what they right-clicked on. Users are free to click on members, measures or combinations of such elements to trigger the creation of the underlying logic and resulting visual effect.
Context menu driven CF is a good technique for applying "cell-centric" conditional formats.
Conditional Formatting Logic in Context Menus
Conditional Formatting is usually dynamic, adjusting to the actual data in queries based on user interactions or simply from changes in the underlying data source (and both). The CF logic triggered from the context menu is designed to cover often used "classic" use cases. In the event users want to drive more complex logic or bespoke options, they can use the drop zones ,advanced CF dialog box or the more sophisticated mathematical logic using custom formulas and KPIs.
The quick color and logical formatting choices in the menu include the following:
- Background Colors (changing the background color of the grid cells)
- Color Scale using a linear spread of 3 colors
- Color Scale using above and below average of the cells in the logic using 2 colors
- Color Scale using a quartiles spread based on values with 4 colors
- Foreground Colors (changing the color of the fonts of values)
- Color Scales using a linear spread of 3 colors
- Color Accounting using positive and negative values using 2 colors (specifically black and red)
- Color Top Quartiles using the top 25% of values with 2 colors
- Color Bottom Quartiles using the bottom 25% of values with 2 colors
- Shapes
- Tri-band colored arrows using the ranked order of values split into 3 even tertiles using 3 colors and rotating arrows (0-180)
- Reverse Tri-band colored arrows using the ranked order of values split into 3 even tertiles using 3 colors and rotating arrows (0-180). The colors are in reverse though.
- Tri-band colored shapes using the ranked order of values split into 3 even tertiles using 3 colors and differing shape fills.
- Tri-band non-colored arrows using the ranked order of values split into 3 even tertiles using rotating arrows (0-180)
- Tri-band non-colored shapes using the ranked order of values split into 3 even tertiles using differing shape fills.
- Data Bars
- 5 colored variations of a mini cell data bar using a fixed color and a value that a percentage of the maximum value across all affected cells.
- Values (or mini text)
- Mini value text shown in the data cell opposite the primary value showing the cell's percent of the total across all affected cells.
- Mini value text shown in the data cell opposite the primary value showing the cell's percent of the maximum cell value found across all affected cells.
- Click here for more details on conditional formatting logic.
Using the Conditional Formatting Context Menus
Matrix and Tabular Grids
The Conditional Formatting context menu options are exposed through a right click on the members of the matrix grid (both row and column axes) or the column header of a tabular grid.
When right clicking on a matrix grid, the menu will adjust to show options based on what is in the axis. There are 4 basic configurations:
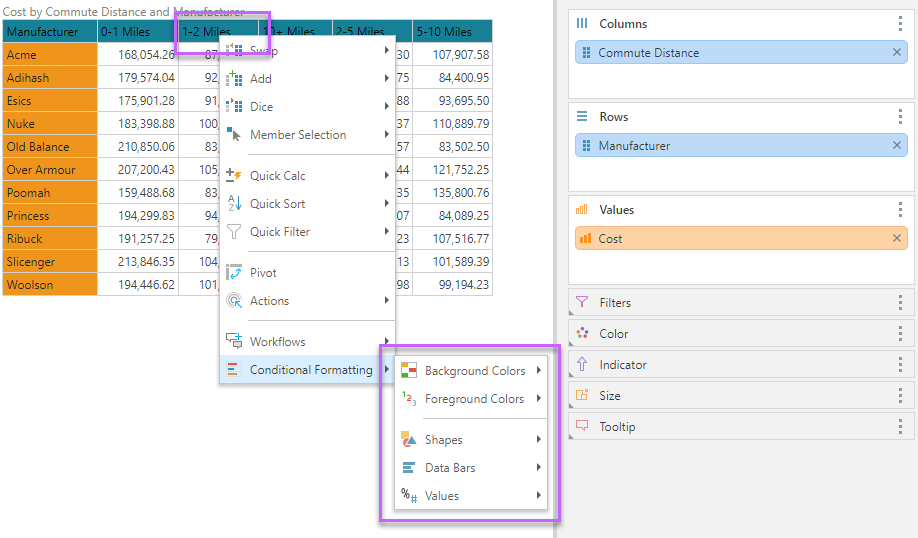
In this scenario, there is only a single measure in the grid, and it is reflected as a background selection. Here the CF menu shows the choices directly for the member that drives the context click. So in the image below, "1-2 miles" triggered the menu, which will color all the cost items for manufacturer (on the cross axis) by one of the choices.
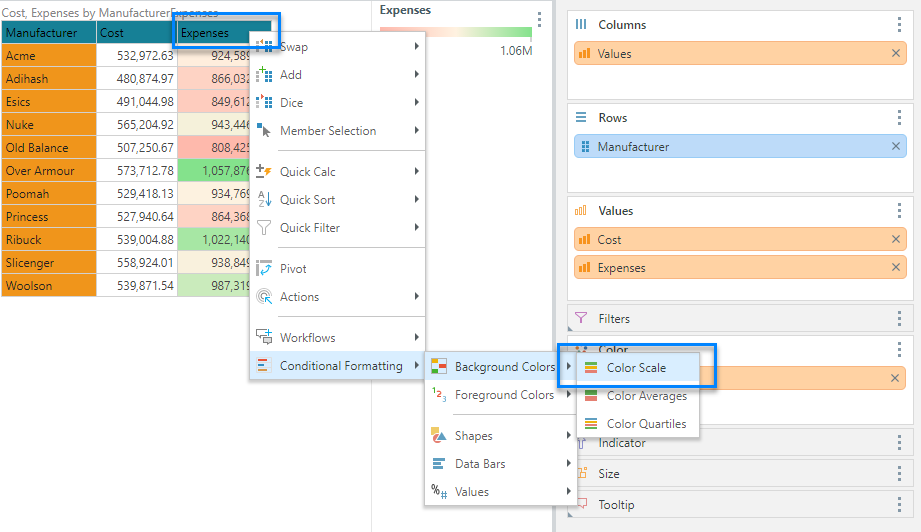
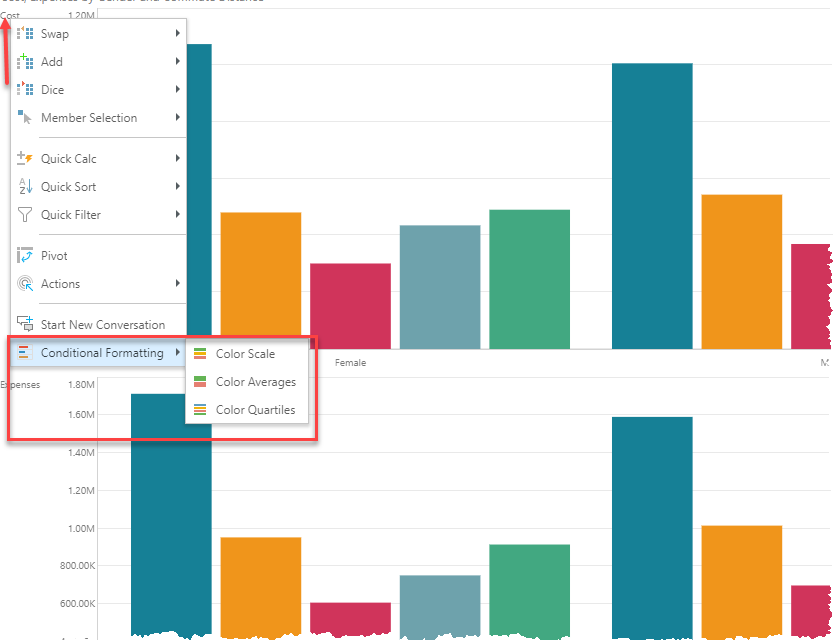
In this scenario, there are two measures in the grid. Here the CF menu shows the choices directly for the metric that drives the context click. Since there is no contention, the CF menu is direct without further delineation required (unlike the others below). So in the image below, "Expenses" triggered the menu, which will color all the expense items for manufacturer (on the cross axis) by one of the choices - in this case a simple background linear color range.
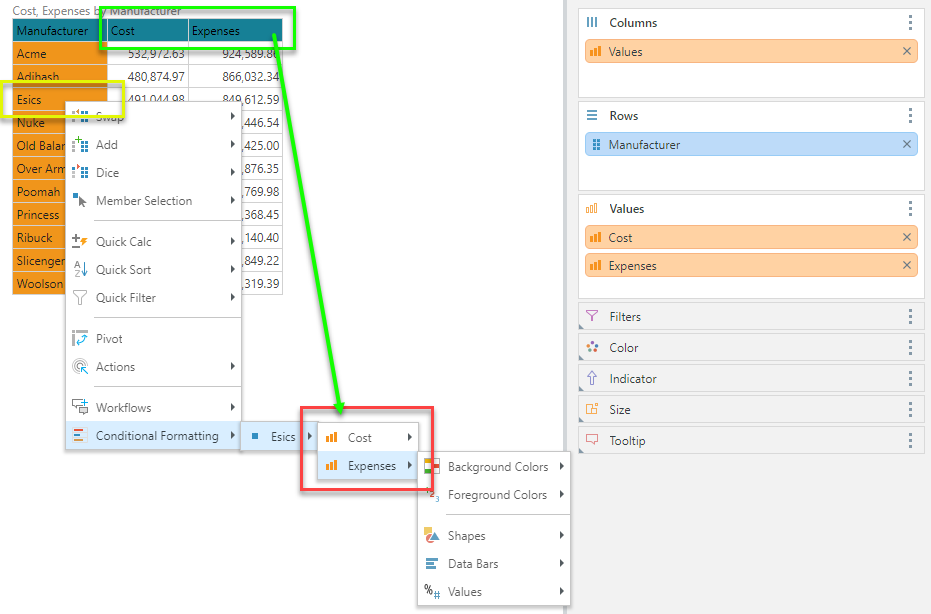
In this scenario, there are two measures in the grid like the scenario above, except the user triggers the menu from the member "Esics". Here the CF menu shows the choices for the member that drives the context click, but the user needs to elect which measure the logic will be set again (red box). So in the image below, "Esics" triggered the menu, but the user must pick a measure first, and then choose the CF style and logic.
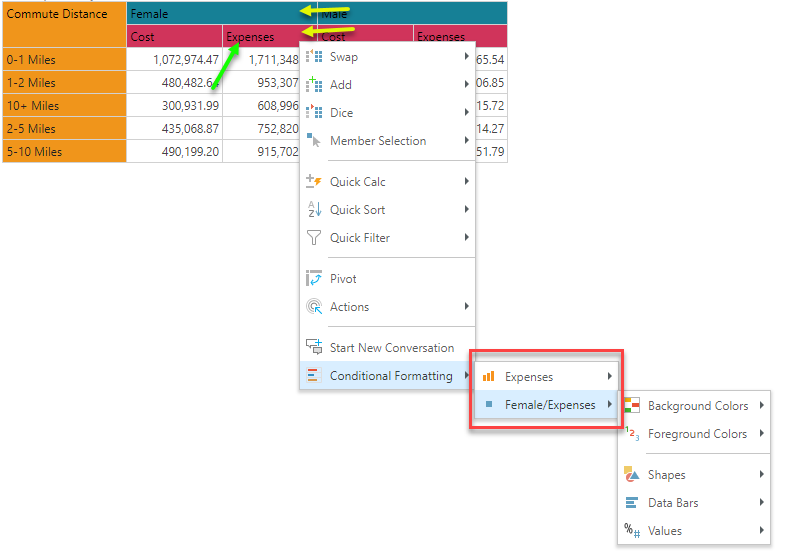
In this last scenario, there are two measures in the grid combined with a hierarchy (on the column axis in this case). The CF menu will change depending on which member the user selects. If the user clicks on Expenses (green arrow), they will be promoted to choose when the CF logic applies to all expense data points in the query or to the specific "column" selection - in this case the combination of "female" and "Expenses". The reason this combination is presented is because the user clicking on the expenses under female - and the engine is unclear whether the user wants all expenses or the specific female expenses column (double yellow arrows). Note that ff the user clicked on females instead, they would be asked to choose which measure the logic applies to, since CF logic can only be designated to a single measure at a time.
Charts and Other Visualizations
The Conditional Formatting context menu options are also exposed through a right click on the members of other non-grid visuals. However, the use cases are far more limited, since the visuals can only usually be affected by (fill) colors. Therefore, the menu shows a limited set of color scale options. Generally the menu can be triggered off category axis members and trellis axis members.
Formulation Logic to Handle CF for specific Cells
To make the conditional formatting easier to configure, and applicable to a subset of data cells (rather than entire measures), the context menu employs a PQL function to tell the system which data cells should be included in the CF logic rule. To achieve this, the menu's automatically employ the "HasDataPoint" function - which allows the user to designate which slice of the query result set are in or out of the logic "zone."
Importantly, this function is a standard PQL function that can be used manually elsewhere for alternative purposes and it can be embedded. It can also be parameterized and embed other calculations to offer a very sophisticated set of options for designing and implementing CF.